2006 Spam Statistics
For 2006 I kept very detailed statistics on spam. Below is a summary of some quick analysis that I did. I have a bunch of other data so if there is something else that you are interested in let me know and I'll see if I can extract that information.
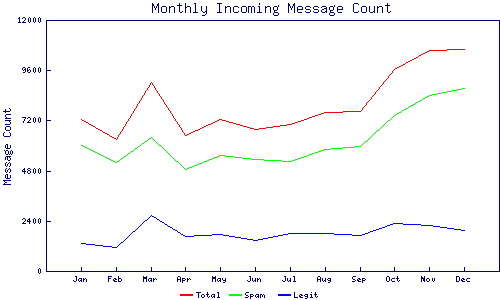
First the high level numbers: 95,706 total emails for 2006 of which 74,458 were spam or roughly 78%. I should consider myself "lucky" since the average usually reported is around 90-95%. This translates to about 204 spam messages a day.
I whipped up some GD images to show these spam numbers in action. The spike in March is due to a high volume mailing list that I temporarily signed up for.
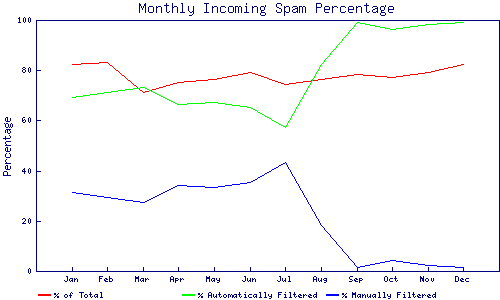
Prior to the middle of August of this year my spam filtering setup was pretty bad. As a result up 60 spam messages a day were getting through and had to be manually flagged. After updating my spam filters, I'm now only manually flagging 5 messages a day. I don't keep statistics on the number of false positives since I don't want to or care to look at 200 plus messages a day.
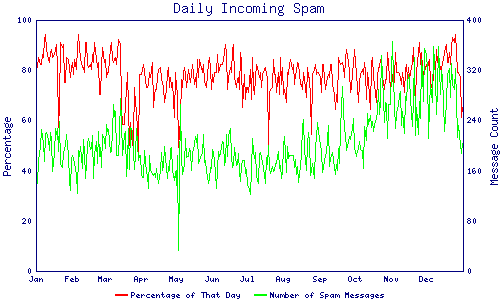
This is a day by day breakdown of spam percentage and message counts. Notice the general trend that while the percentage is constant the total number of spam messages per day is increasing.
Comments
Posted by: NotJeff | January 2, 2007 1:59 PM
Posted by: Daniel R. | January 2, 2007 3:45 PM
Posted by: NotJeff | January 9, 2007 2:20 PM
Posted by: DanielR![[TypeKey Profile Page]](https://life.neophi.com/danielr/nav-commenters.gif) |
January 10, 2007 8:26 AM
|
January 10, 2007 8:26 AM
Posted by: NotJeff | January 10, 2007 11:29 AM